Abusing EVT just that little bit more.
‘well I put to you…….that you sucked off a horse’ – Ali G
Published by Tsehp 2002
Tools:
Microsoft Embedded Toolkit: http://download.microsoft.com/download/wince/Install/3.0/W9X2K/EN-S/EN_WINCE_EMBDVTOOLS30.exe)
Microsoft ActiveSync
IDA Pro with support for your PPC/HPC processor
Pre-requisite’s
Please read heXc’s lovely tutorial on real-time debugging (“Abusing Microsoft's EVT as a debugger”), using EVT. I had previously attempted to find a debugger for my HP Jornada (HPC), but failed. This tutorial wouldn’t exist without his timely breakthrough.
Introduction
This tutorial is meant to be an addition, to heXc’s. I am attempting to provide information and strategies not displayed by heXc(no disrespect ;P). First of all, I would like to display a few pros and cons I have discovered whilst cracking all of my registerable wince applications.
|
Advantages |
Disadvantages |
|
All debugging is, of course, done in ring-3. This means that you can debug without halting the system. |
My HPC/PC link is slow, making debugging very slow sometimes. |
|
It’s possible to do most important debugging functions |
I can’t find any handy BPM/BPR and there is also no breakpoint on API/Export that I can find. |
|
It’s the only way (I know) to real-time debug WinCE apps ;) |
Must actually own, and use a PPC/HPC (cant use emulator) |
In most respects the EVT debugger is akin to OllyDebug, the major difference being speed. However this can sometimes be overcome using some tips.
Tips
- Use IDA!!! Load IDA and use it to look around wherever you are in code. With your IDA window loaded, synchronize it at the same address as EVT PC counter is on often.
- When debugging, pressing F10 is equivalent to F10 in softice, it steps forward one statement. However this can be very slow going. Instead of using F10 to single step make extensive use of the button: ‘Run To Cursor (CTRL+F10)’. Use it to skip 3 or 4 instructions at a time, and use F10 only when you’re at important code.
- Use CTRL+G to go to an address in the debugger, to snoop around and also for setting breakpoints. This is very useful (thanks heXc).
- Use ALT+F9 (Edit->Breakpoints) for all your breakpoint needs ;) You can also right-click on the instruction you wish to set a breakpoint on and select ‘Insert/Remove Breakpoint’
- For some reason (is this only my copy of EVT?) EVT refuses to make proper use of F11 (‘Step Into’). It skips over BL (Branch With Link, equivalent to x86 CALL instruction) as if it is a normal instruction. To step into a BL/CALL you must use Ctrl+G to goto the address BL is pointing to, and manually set a breakpoint on the first instruction.
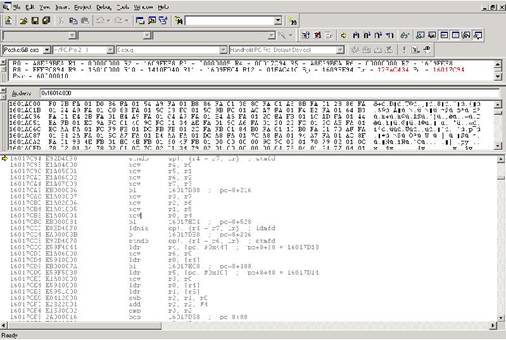
- Set up your workplace! Here is a screen shot of mine:

This can be achieved by adding the ‘Register’, ‘Memory’ Debug window (View->Debug Windows->Memory) and removing all other crap.
Breaking on DLL’s
I got asked how to break on a .dll using EVT, and resolved myself to figuring it out. This is how I did it.
First of all, copy your target executable over to a local directory, such as C:\wince\. Copy over the .dll you wish to debug, that the target executable makes use of (Copy them all over if you wish).
Setup EVT as you normally would, adding the remote path to the Debug tab under Project->Settings. However, after doing this, change Category from ‘General’ to ‘Additional .dll’. Add your target .dll files to the list. (note: this may not be necessary, but it cant hurt ;))
Hit F11 to load your target. Once loaded, goto: Debug->Modules, and view the list of attached modules.
NOTE: If your .dll isn’t
present on loading the project into the debugger, you may have to hit F5 (‘Go’)
and wait until the program is loaded, then click ‘Break Execution’ to break
into the debugger, before proceeding.
If yours is there, take note of its Address space. Mine was 0x017040000 – 17071FFF. Close the window, and check your IDA dead-listing for the address of the first instruction (scroll to the very top) for the local DLL. Mine was 0x00101000.
Now minus the ImageBase (use LordPE or procdump) of the .dll which was 0x010000, I get 0x01000. Add the 0x01000 to the starting mapped address 0x017040000 and you get: 0x017041000.
Hit CTRL+G and type: 17041000 and hit enter, EVT goes there. Compare the uppermost instruction, to the IDA disassembling and it works!
Now whenever you have to breakpoint on any instruction in the .dll, just find the address in the dead listing, remove the image base, and add the address of the start of the mapped module. It’s a tedious task, but possible. Hopefully you won’t have to do it very often ;)
Conclusion
As usual, as soon as a live debugging technique is discovered, software protection is soon thereafter destroyed. WinCE is no exception. I feel a fuzzy feeling every time I use MS EVT to crack MS WinCE products. It gives one a certain satisfaction ;D
Thanks again to heXc, hope you like it…
NchantA
